After dip in May, air cargo recovery got back on track in June: CLIVE
July 8, 2021: After May’s subdued performance, global air cargo resumed its long and winding road to Covid recovery in June with a 1 percent growth in demand versus the same month of 2019, as airlines continued to micromanage cargo capacity, according to the latest industry volume, load factor and rates data from analysts CLIVE Data Services and TA

July 8, 2021: After May’s subdued performance, global air cargo resumed its long and winding road to Covid recovery in June with a 1 percent growth in demand versus the same month of 2019, as airlines continued to micromanage cargo capacity, according to the latest industry volume, load factor and rates data from analysts CLIVE Data Services and TAC Index.
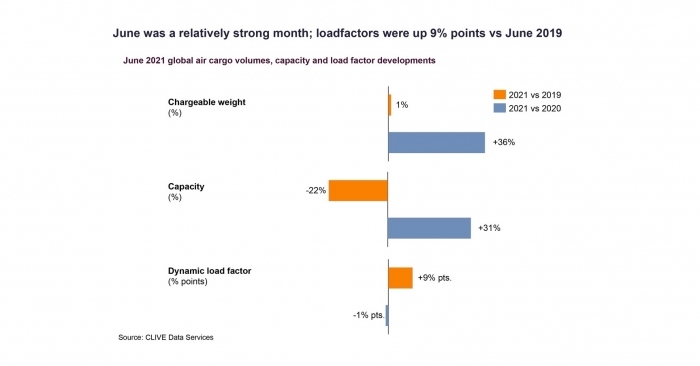
While the chargeable weight in June 2021 returned to growth after the 4 percent fall in May versus 2019, market analysis shows the buoyant air freight rates and load factors of recent months, whilst still at a high level, do appear to be declining marginally.
Versus 2020, last month’s demand was 36 percent up. The available global capacity compared to the pre-Covid market conditions of 2019 was 22 percent down, but up 31 percent over June 2021.
Based on analyses of both the volume and weight perspectives of cargo flown and capacity available, CLIVE’s dynamic load factor for June was 9 percent points up versus 2019, and 1 percent points down versus June 2020.
Niall van de Wouw, Managing Director of CLIVE Data Services, said, “June’s performance data was relatively strong and seems to confirm that May’s decline was a one-off, as we anticipated, impacted by the public holidays during that month. However, this modest growth is much more related to the lack of capacity supply than strong demand, given the uncertainly that still exists internationally. In June, we once again saw no signs of recovery in capacity. It is abundantly clear that airlines are micromanaging their flights because the pressure is everywhere and, in the case of cargo-only services by passenger airlines, the capacity out there is expensive to operate. If rates continue to decline, they are expected to take capacity out of the market - but, overall, we expect load factors and rates to stay elevated, with no short-term trend to change this.”
CLIVE’s weekly and monthly global air cargo market analysis for June revealed a continuing year-over-year drop in dynamic load factor. Whilst up 9% pts compared to the level seen in 2019, compared to 2020 data, load factors have decreased from 72% in March, 71% in April, 70% in May, and now to 69 percent in June 2021.
TAC Index also pointed to the current level of constrained capacity and its impact on strong load factors and demand.
Gareth Sinclair of TAC, said, “There are growing concerns that capacity will continue to be constrained for some time as passenger operations start to pick up, reducing available belly hold capacity and opportunities for cargo-only services. The BAI (Baltic Air Freight Indices) decreased by 10 percent in June over the year-to-date high seen in May, with week-on-week reductions until the final week in June, which saw a modest improvement. 15 of the 17 trade lane indexes saw a reduction over May with only SIN to SEA showing good growth at 4 percent and LHR to SEA up a modest 0.3 percent.
“Although the index was down in May, it was still positive versus last year at 18 percent and, versus 2019, by 88 percent, reflecting both the level of demand and continuing constraints in capacity. Overall, demand was relatively flat in June over May, but this continues to differ by trade lane. Dynamic load factors from Europe to New York and Chicago continue to be over 80 percent, for example, driving stronger pricing levels compared to trade in the opposite direction, where demand is not so strong.”
Both the China and Hong Kong markets saw declines in June over May of 9 and 15 percent respectively, TAC Index stated, while the European market continues to be volatile.


