Air cargo in May records 11 percent rise over Apr; far from normal: WorldACD
June 19, 2020: Worldwide, in May 2020, chargeable weight carried by air decreased 29 precent compared to May 2019.

June 19, 2020: Worldwide, in May 2020, chargeable weight carried by air decreased 29 precent compared to May 2019. As the final YoY figure for the month of April was a decrease of 34 percent, the conclusion may be that May showed a slight improvement. The improvement was also visible month-over-month (MoM), as May showed an increase over April of 11 percent.
In terms of yields/rates, we had witnessed a completely uncommon 63 percent MoM-increase in April, when a good part of cargo capacity suddenly ‘disappeared’ as passenger aircraft stopped being operated. The MoM-increase in May was 5 percent. In other words, worldwide yields/rates still went up, from USD 3.74 to USD 3.95, despite additional capacity coming to the market by an increasing number of passenger aircraft being (partly) converted into freighters.
Region-wise air cargo
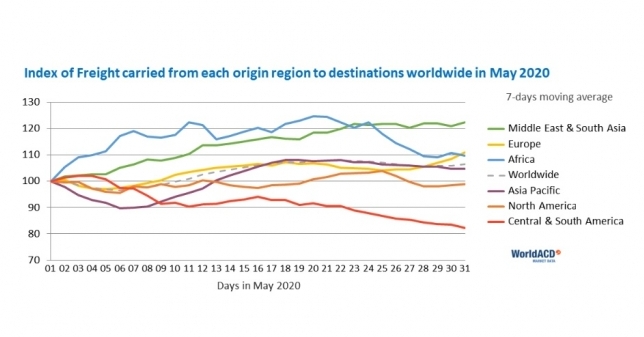
The market origin the Middle East & South Asia (MESA) had suffered most in April (-70 percent YoY), but came back strongest in May (+45 percent MoM). The other origin regions showed an MoM increase varying from 4 percent (North America) to 14 percent (Central & South America). The origin Africa showed the largest increase in USD-yields/rates (+13 percent MoM) whilst changes in other regions hovered between -10 percent (Europe and North America) and +12 percent (Asia Pacific & MESA).
Top markets for air cargo
The market from China-East to Germany benefited most from the recent, very drastic market changes: although it slightly decreased in volume MoM, its YoY increase topped 60 percent both in April and in May. Its performance for the year-to-date (January–May) was +24 percent. Other top markets that performed much better than average in the year-to-date, include Hong Kong – USA Pacific (+16 percent) and China East-USA Midwest (+29 percent). The top markets that suffered most so far this year, were Kenya-Netherlands (-28 percent) and Germany-China East (-24 percent).
Pharma & perishables
In the different product categories, the most unexpected development was a 1 percent YoY decrease in pharmaceuticals & temperature-controlled goods, the first such decrease for this category in 2020. The larger perishable categories outperformed the market as a whole in MoM growth: Fruits & Vegetables +16 percent and Fish & Seafood +26 percent.
Looking at what happened within the month of May, the most striking features were:
- the continuous weekly drop of worldwide USD-yields/rates: from USD 4.29 in the first days to an average of USD 3.52 for the last week;
- the daily pattern recovering from the steady drops shown in April.
Capacities & load factors
The much-reported increase in passenger aircraft being transformed into ‘quasi-freighters’ was visible in the strong load factor jump in passenger aircraft. Within the month of May, we also noted a drop in the market share of the freighter companies between the first full week of May and the last one, another sign that the conversions started to have some impact.


